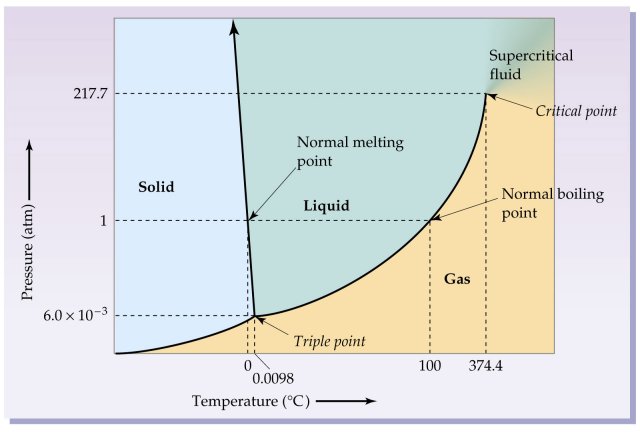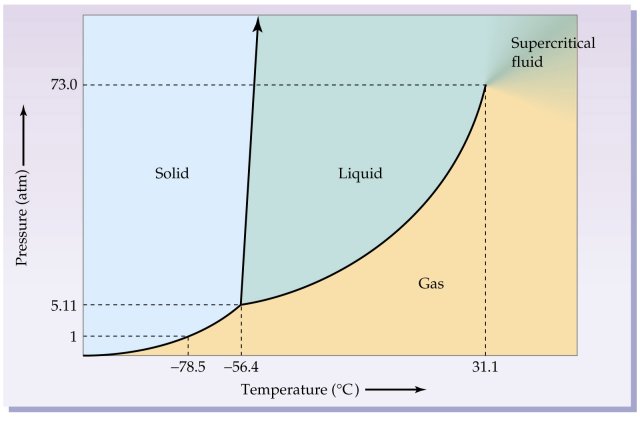
Now we are ready to answer the questions. Just look at the graph and compare to the answers given below.
Before answering the questions below, we first bring up the phase diagram.
Now we are ready to answer the questions. Just look at the graph and compare to the answers given below.
| a) | T = -60°C, P = 0.75 atm | A gas. |
| b) | T = -35°C, P = 18.6 atm | A liquid. |
| c) | T = -80°C, P = 5.42 atm | A solid. |
You may wish to mark these points on the graph. Please don't damage your computer screen, however!Problem 10.83: Look at the phase diagram of H2O in Figure 10.28 and tell what happens to an H2O sample when the following changes are made:
As with the previous problem, we first show the phase diagram.
Now, we answer the questions.
| a) | The temperature is reduced from 48°C to -4.4°C at a constant pressure of 6.5 atm. | We start with liquid water and end up with ice. This diagram is not quite to scale, but it is still easy to figure this out. |
| b) | The pressure is increases from 85 atm to 226 atm at a constant temperature of 380°C. | 380°C is above the critical temperature of water. Thus, the water remains a gas albeit a very dense one. At this point, water is behaving as a supercritical fluid. |
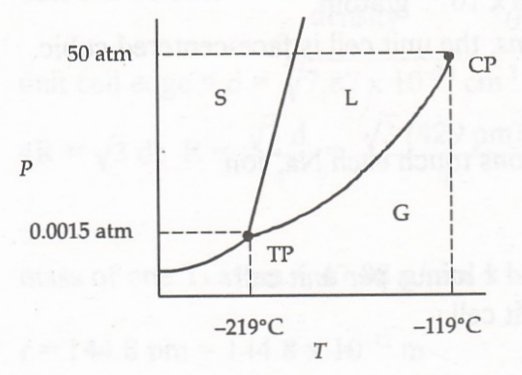
Problem 10.85: Oxygen has Tt = 54.3 K, Pt = 1.14 mm Hg, Tc = 154.6 K, and Pc = 49.77 atm. The density of the liquid is 1.14 g/mL and the density of the solid is 1.33 g/mL. Sketch a phase diagram for oxygen and label all points of interest.
We spare you my horrid art work and give the phase diagram as drawn in the intructor's manual:Problem 10.87: Refer to the oxygen phase diagram you sketched in Problem 10.85 and tell what phases are present under the following conditions:There is a little guesswork to some parts of a diagram like this, especially the smooth curve between the liquid and gas phases and between the solid and gas phases. We could draw the line between solid and liquid to scale if we wanted to, but we shall content ourselves with this rough drawing. However, it is wise to have all the points in order! In any event, the questions posed in the next problem are ones which can be answered even by this crude diagram.
| a) | T = -210°C, P = 1.5 atm | Here, we would expect liquid oxygen. |
| b) | T = -100°C, P = 66 atm | At this point, we are above the critical temperature. Thus, one would expect oxygen to be a supercritical fluid at this point. |
Problem 10.89: Assume that you have samples of the following three gases at 25°C. Which of the three can be liquefied by applying pressure, and which cannot? Explain.
Ammonia: Tc = 132.5°C and Pc = 112.5 atm
Ammonia here can be liquefied since it is below the critical temperature. Note that the size of the critical pressure is irrelevant in this case. Temperature is all we need to look at in cases such as this.Methane: Tc = -82.1°C and Pc = 45.8 atm
Cannot be liquefied. It is far above the critical temperature.Sulfur dioxide: Tc = 157.8°C and Pc = 77.7 atm
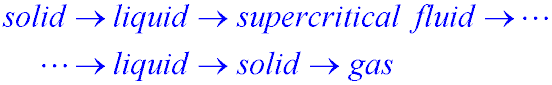
This gas is well below its critical temperature and can be liquefied.Problem 10.90: Benzene has a melting point of 5.53°C and a boiling point of 80.09°C at atmospheric pressure. Its density is 0.8787 g/mL when liquid and 0.899 g/mL when solid; it has Tc = 289.01°C, Pc = 48.34 atm, Tt = 5.52°C, and Pt= 0.0473 atm. Starting from a point a 200 K and 66.5 atm, trace the following path on a phase diagram:Note that both ammonia and sulfur dioxide are used as working fluids in large, commericial compressors for heavy-duty refrigerators. They used to be used in home refrigerators and air conditioners but, with the advent of freon and its successors, are no longer used in the home since, if there were a leak... .
| (a) | First, increase T to 585 K while keeping P constant. |
| (b) | Next, decrease P to 38.5 atm while keeping T constant. |
| (c) | Then, decrease T to 278.66 K while keeping P constant. |
| (d) | Finally, decrease P to 0.0025 atm while keeping T constant. |
What is your starting phase and what is your final phase?
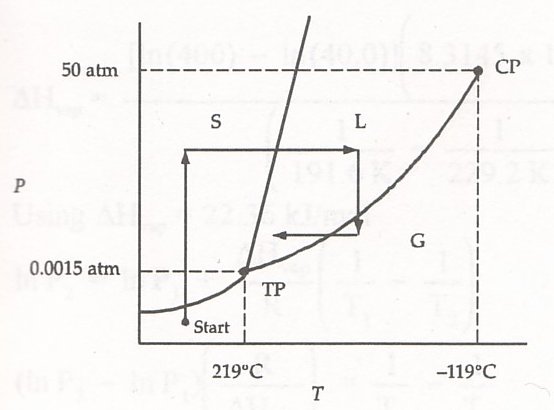
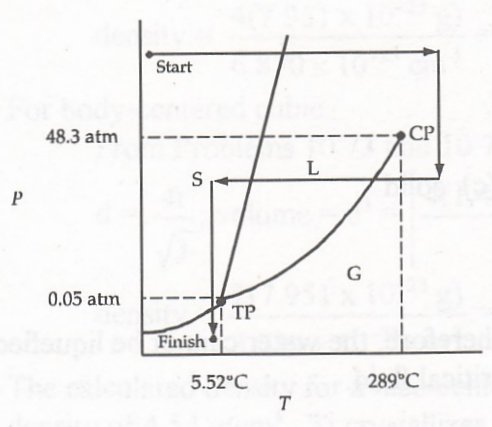
Here is a phase diagram (again stolen to protect you from my pathetic art work).Problem 10.91: Refer to the oxygen phase diagram you drew in Problem 10.85 and trace the following path starting from a point at 0.0011 atm and -225°C.The various lines are drawn and you can read what happens at each point. The bottom line to this problem is just this:
Benzene is a solid here. It ends up as a gas.
| (a) | First, increase P to 35 atm while keeping T constant. |
| (b) | Next, increase T to -150°C while keeping P constant. |
| (c) | Then, decrease P to 1.0 atm while keeping T constant. |
| (d) | Finally, decrease T to -215°C while keeping P constant. |
What is your starting phase and what is your final phase?
Here is "our" phase diagram again. Let's hope that it is good enough for this really difficult problem. Actually, let's use the authors' doctored version for some variety.Problem 10.92: How many phase transitions did you pass through in Problem 10.90 and what are they?Here are our results given in bottom-line fashion:
Benzene is obviously a gas here. It's pHate in this case is to end up as a liquid.
We show these in the order they occur in the diagram with the Problem 10.90. It is, of course, assumed that this was drawn perfectly! The diagram is shown under the answer for easy comparison.
Problem 10.93(+): What phase transitions did you pass through in Problem 10.91?
We do a similar analysis here with a suitably doctored phase diagram.